

At neighbourhood level, Covid-19 case rates have been published for the week to December 23
Here are the neighbourhoods in the Chichester District with the biggest rise in case rates in the past week.
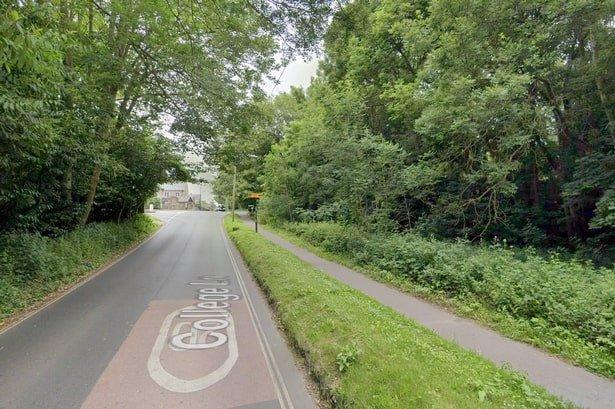
1.
College Lane and Oaklands had 1143.6 Covid-19 cases per 100,000 people in the latest week, a rise of 58.3 per cent from the week before.
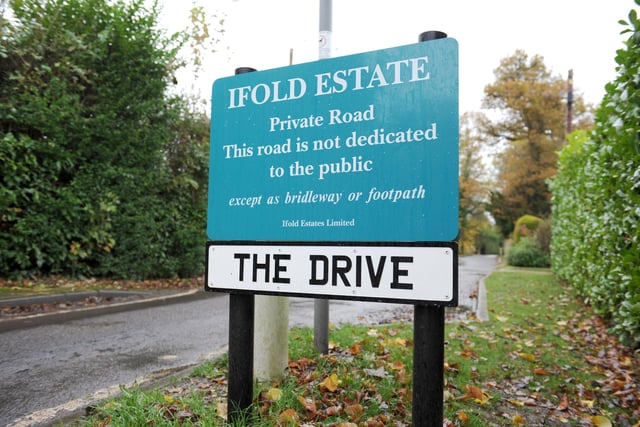
2.
Ifold and Wisborough Green had 1067.8 Covid-19 cases per 100,000 people in the latest week, a rise of 71 per cent from the week before.
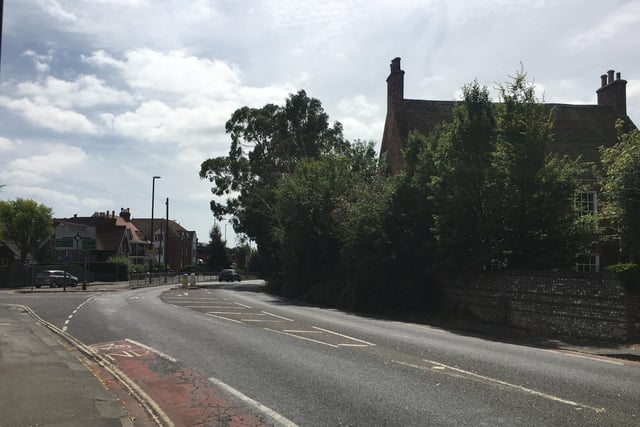
3.
Stockbridge and Fishourne had 1007.5 Covid-19 cases per 100,000 people in the latest week, a rise of 6 per cent from the week before. Photo: atex.scriptmanager
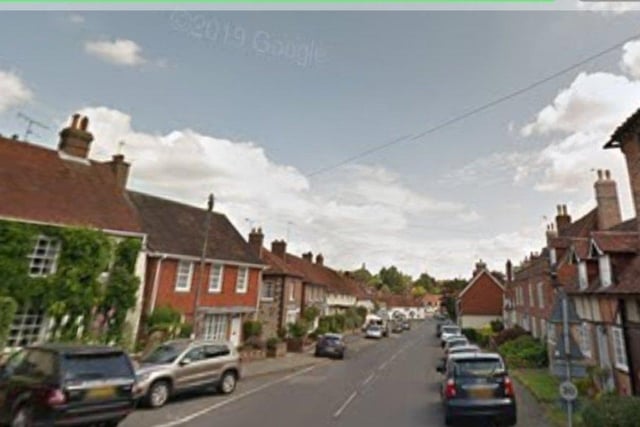
4.
Milland and South Harting had 1006.4 Covid-19 cases per 100,000 people in the latest week, a rise of 31.8 per cent from the week before.